MAS 965 : Social Visualizations
Tripti Gore Chandorkar
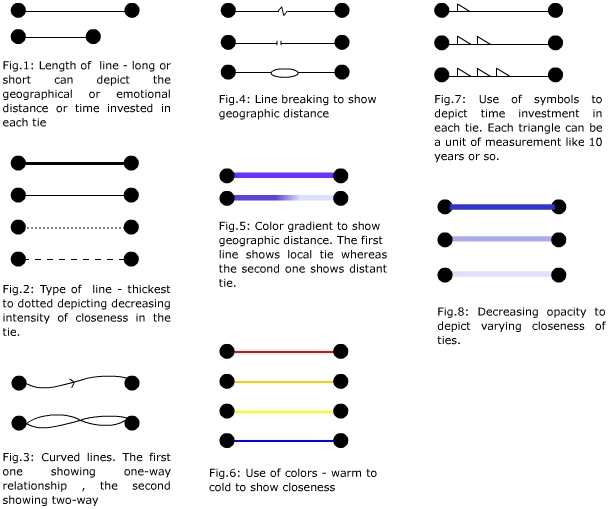
Sketches. Think about how you can draw lines: they can be thicker, thinner, longer, shorted. They can be solid or dashed, dark or light, wavy, straight or angular. 1. Draw a series of lines they vary along these and other dimension. Write a 1 line description of the type of data you think would be useful to depict with that variation (e.g. what would you try to depict with color vs with angularity etc).
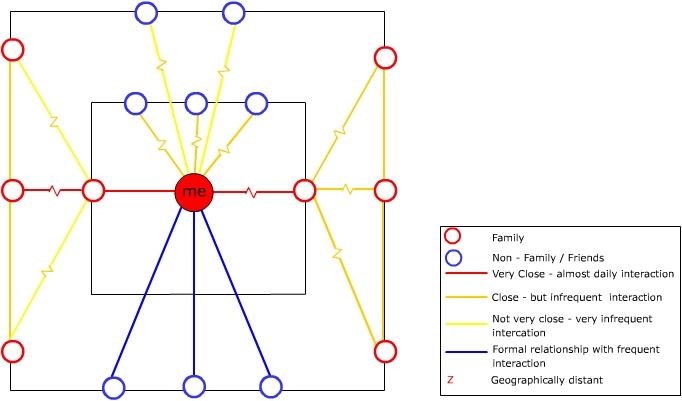
Think about the problem we discussed in class about showing people who are physically distant but personally close. If a long thick line is used it may be too prominent. We talked about different solutions to being able to vary the length of a line while maintaining a constant sense of its overall weight or importance. Try sketching 2 or 3 solutions to this problem.
I have sketched two solutions for the problem of depicting personally close people who are physically distant by adapting my social network diagram from the first assignment.
a) The first diagram makes use of uniform line color but different line types to depict different intensities of relationships and close/not so close ties that are geographical distant.
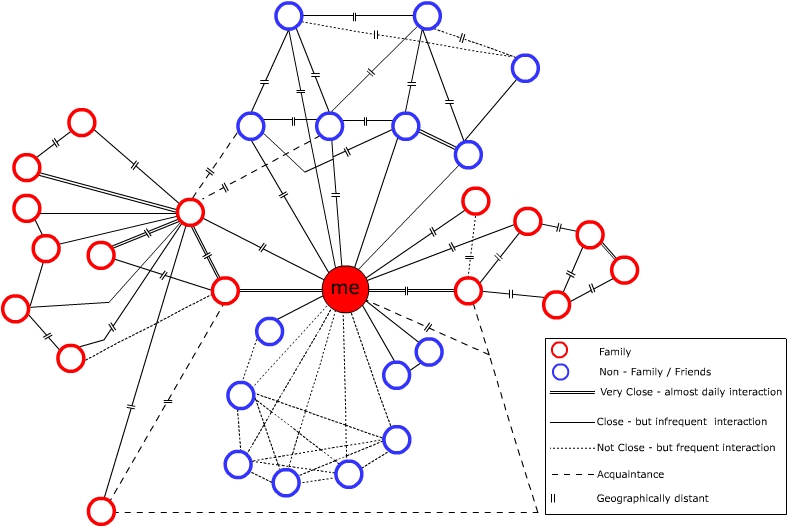
b) The second diagram uses the same line type but variations in line color to depict different intensities of relationships and close / not so close ties that are geographical distant.