


MAS 965 : Social Visualizations
Tripti Gore Chandorkar
Assignment 3
Abstract Sketch of real life conversation :
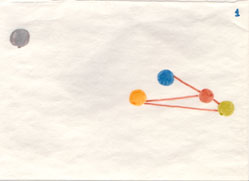
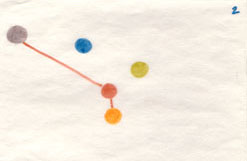
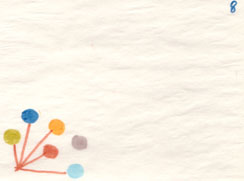
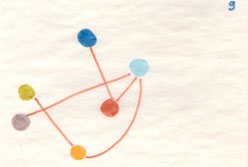
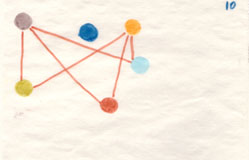
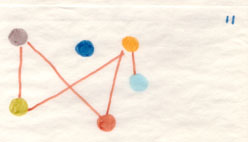
For the purpose of this exercise, I observed an informal get togther of myself and my friends over the weekend. To give a brief background, there were six people who came in and left at different times.
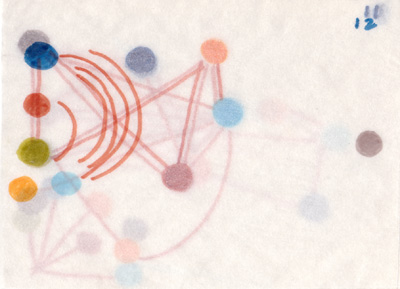
The visualization of the conversation is a series of 12 images sketched on tracing paper. The visualization is a transition over time as well as space. Each participant of the conversation is denoted by a dot of a different color. Any verbal exchange that heppened between two participants is shown by a red line between the two. The dots denote the participants and their respective positions to each other. For the best analysis, the 12 images should be seen as stacked together in real life(in class tomorrow). Stacking all the images gives an idea of the density of space occupied by the particpants and density of conversation(concentration of red lines) over time. If the same process was done digitally by changing the opacity of the participants at each level and then superimposing all the imges, the effect would have been more observable.
|
|
|
|
|
|
|
|
|
|
|
|
Scanned superimposed image:
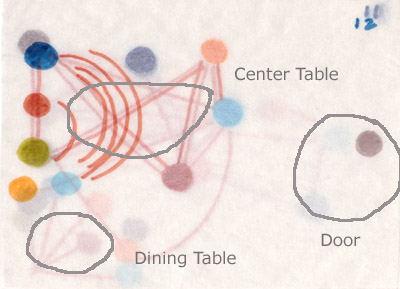
After reading Goodwin's paper, it is interesting to note how physical objects like the center table, dining table with food served on it and the entrance door in this example, can be conversation starters and sustainers.
Click Here to see the animated visualization with text.