
MAS 965 : Social Visualizations
Tripti Gore Chandorkar
Assignment 4
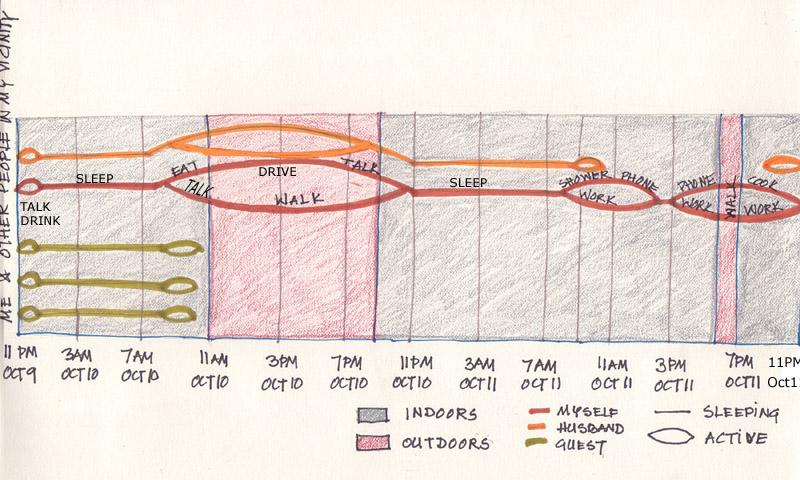
Following are the two sketches of maps of my past one year and 48 hours. The elements mapped in the two sketches are similar. The sketches map three different dimensions of my life in the past one year and 48 hours time scale - my state/activity, surrounding people and location. I have depicted myself as the thick red line that changes shape as I pass through different stages on the time scale. The x - axis is the time scale and the corresponding location on that scale. The y -axis depicts the number of different people in my life at any particular time on the scale. I have included the dimension of 'people in my vicinity' in my sketches as I feel that it becomes an important factor in determining my activity/state and location during that time period. Due to the long time scale of the first sketch (past one year ) it depicts my state in only two categories - working or on vacation. The second sketch( past 48 hours) is an example of a detailed zoomed in portion of the first sketch showing an account of different activities in the past 48 hours. As one can observe, the different people in my life certainly shape different acitvities I have been involved with or vice versa.
| Personal map of past one year |
|
| Personal map of past 48 hours |
|